Graphs on dashboard show statistics of another timeframe than selected #221
Description
Describe the bug
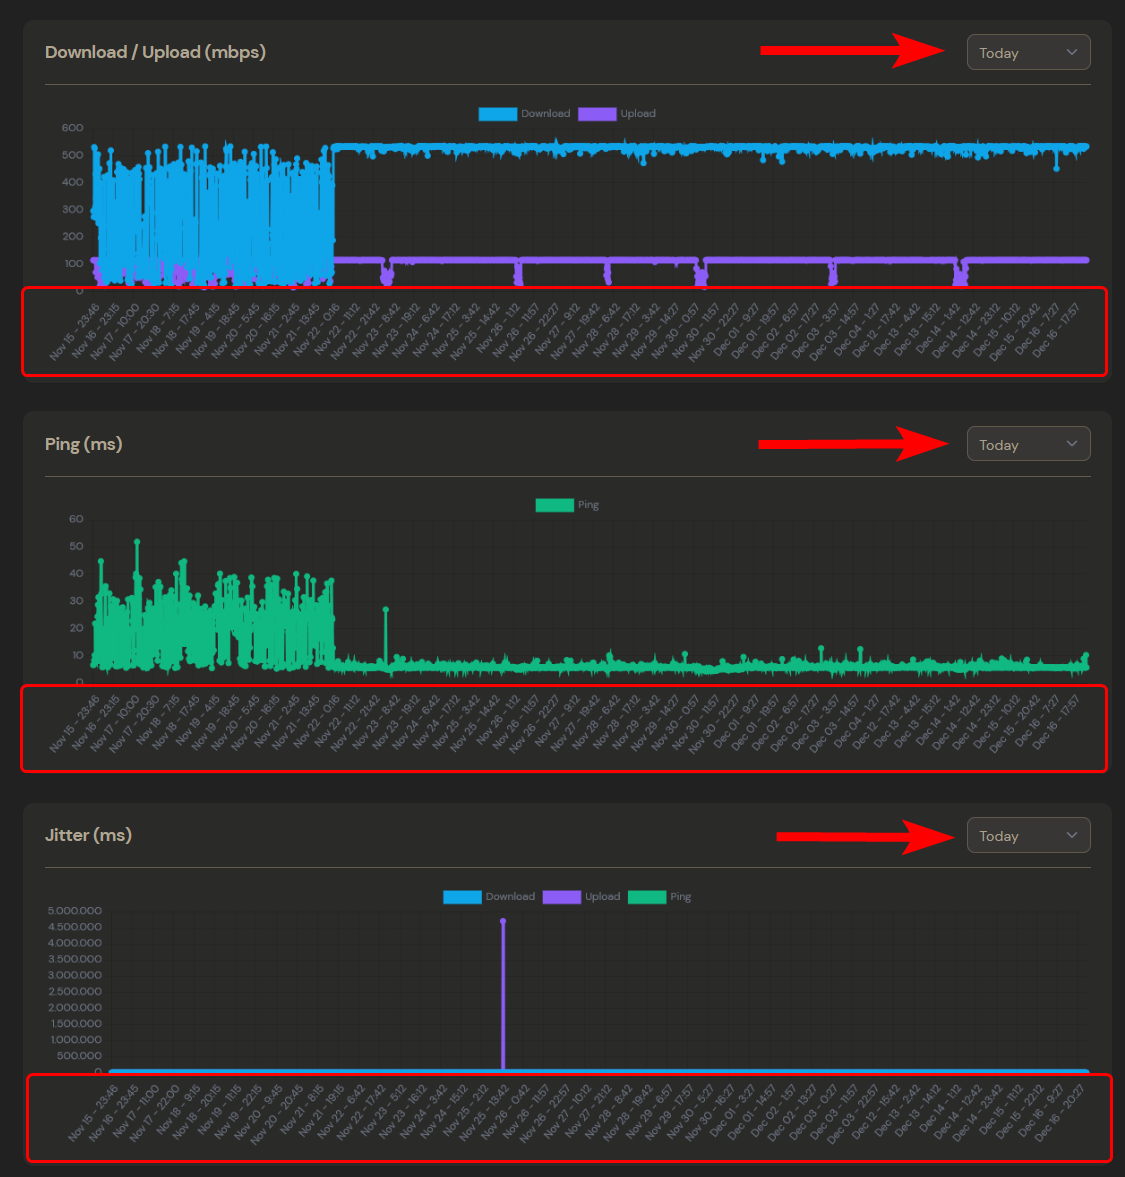
Graphs on the dashboard by default should show statistics from "Today" but they show data of a longer period of time even though "Today" is selected.
Only when I select "Last week"/"Last month" and then switch back to "Today" the graph shows data from the correct timeframe.
To Reproduce
Steps to reproduce the behavior:
- Go to "Dashboard" and check graphs.
Expected behavior
The graphs should only show statistics from today when "Today" is selected.
Environment (please complete the following information):
- OS: [e.g. Ubuntu]
- Architecture: amd64
- Browser: FireFox, Brave, Edge
- Version: v0.7.1
Screenshots